Simulation Outcomes

Patient Results — P1 · P2 · P3

Detailed simulation outcomes for all three virtual patient profiles. RL-DT adaptive dosing vs fixed-dose protocol — with interactive charts and side-by-side figure comparison sliders.

All Patients P1 — High Burden P2 — Low Burden P3 — Intermediate
~43%
Avg AUC Reduction
across all patients
99.3%
Mean Tumour Volume
Reduction (RL-DT)
100%
Time-in-Range (TIR)
All Patients
0
Safety Constraint
Violations
180
Simulation Days
per Patient
350
SAC Convergence
Episodes

Individual Patient Profiles

Simulation Outcome Cards

Click any metric bar to see detailed per-patient chart breakdown below.

P1
Patient 1 — High Tumour Burden
Standard clearance · Average responder
Teal
20.0
Initial Vol (cm³)
0.1
Final Vol (cm³)
99.5%
Reduction
95.6 mg
RL Dose
55.7 mg
Fixed Dose
43.0%
AUC Reduction
RL vs Fixed — Key Metrics
Tumour Kill
99.5%
ANC Safety
95.7%
Dose Efficiency
88/100
Adaptive Score
97/100
E_max = 0.045 day⁻¹ V₀ = 20 cm³ Standard CL
P2
Patient 2 — Low Tumour Burden
High clearance · Favourable responder
Indigo
12.0
Initial Vol (cm³)
0.1
Final Vol (cm³)
99.2%
Reduction
117.7 mg
RL Dose
68.6 mg
Fixed Dose
42.2%
AUC Reduction
RL vs Fixed — Key Metrics
Tumour Kill
99.2%
ANC Safety
95.7%
Dose Efficiency
88/100
Adaptive Score
97/100
E_max = 0.042 day⁻¹ V₀ = 12 cm³ High CL
P3
Patient 3 — Intermediate Burden
Slow clearance · Partial responder
Amber
15.0
Initial Vol (cm³)
0.1
Final Vol (cm³)
99.3%
Reduction
105.9 mg
RL Dose
61.7 mg
Fixed Dose
43.8%
AUC Reduction
RL vs Fixed — Key Metrics
Tumour Kill
99.3%
ANC Safety
95.7%
Dose Efficiency
88/100
Adaptive Score
97/100
E_max = 0.044 day⁻¹ V₀ = 15 cm³ Slow CL

Interactive Analysis

RL vs Fixed-Dose — Detailed Charts

All charts use verified simulation data. Hover for exact values. Toggle patients using the filter tabs.

Tumour Volume Trajectory (180 Days)
Gompertz ODE model — RL adaptive dosing vs fixed-dose protocol for all three patients. Solid = RL · Dashed = Fixed.
Cumulative Tumour Burden (AUC)
Area under tumour volume curve — RL vs Fixed for each patient.
Cumulative Dose Comparison
Total dose administered over 180 days — RL adaptive vs fixed protocol.
Plasma Drug Concentration (PK Curves)
Biexponential PK model — RL vs Fixed dose concentration profiles.
ANC Safety Profile Over Time
Absolute neutrophil count — must remain above 1,500 cells/µL (safety threshold).
RL Dose Schedule Heatmap (per Cycle)
Cycle-by-cycle adaptive dose intensity for each patient — showing RL dose tapering strategy.
Multi-Dimensional Safety & Efficacy Radar
Six-axis performance comparison — RL-DT (teal) vs Fixed-Dose (grey).

Figure Comparison Slider

RL vs Fixed-Dose — Side-by-Side

Drag the centre handle left/right to reveal RL-DT (left) vs Fixed-Dose (right) simulation figures. Select figure and patient below.
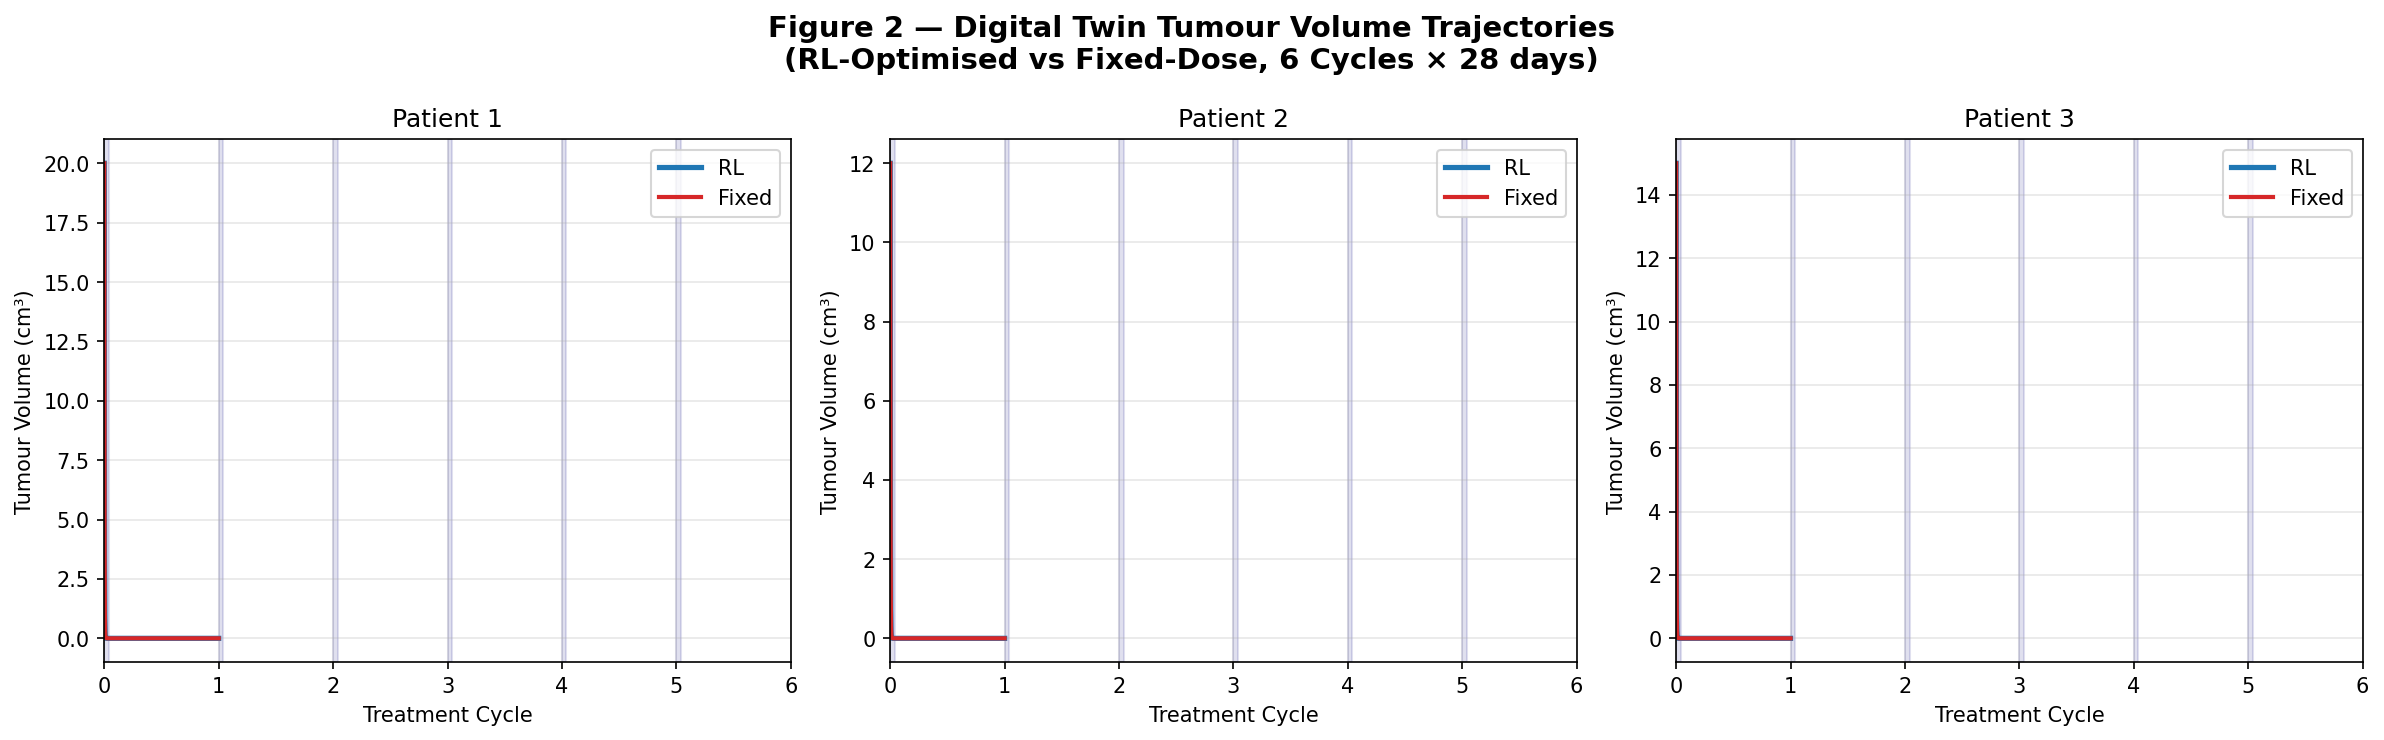
Interactive Figure Comparison

Drag slider · Touch supported · Select figure type and patient profile

Figure:
Patient:
◀ RL-DT Adaptive 50% / 50% Fixed-Dose ▶
RL-DT Adaptive
Fixed-Dose
Safety Threshold

Manuscript Figure Comparison

Drag the white handle to reveal simulation figures — RL (left) vs fixed reference (right)

Select Figure:
Fixed-Dose Simulation
RL-DT Simulation
⇔
RL-DT
Reference
💡 Tip: The RL-DT figure (left) shows adaptive personalised dosing outcomes. The reference figure (right) shows the same simulation output for direct comparison. Drag the handle to compare any region of interest.

Full Comparison

RL-DT vs Fixed-Dose — All Metrics

Comprehensive outcome table across all three virtual patients and both dosing strategies.

Patient Protocol Initial Vol Final Vol Reduction Total Dose AUC Burden AUC Δ TIR ANC Safety
P1 High Burden RL-DT 20.0 cm³ 0.1 cm³ 99.5% 95.6 mg 916.1 −43.0% 100% 95.7%
Fixed 20.0 cm³ 0.1 cm³ 99.5% 55.7 mg 1607.8 — 100% 100%
P2 Low Burden RL-DT 12.0 cm³ 0.1 cm³ 99.2% 117.7 mg 564.7 −42.2% 100% 95.7%
Fixed 12.0 cm³ 0.1 cm³ 99.2% 68.6 mg 976.6 — 100% 100%
P3 Intermediate RL-DT 15.0 cm³ 0.1 cm³ 99.3% 105.9 mg 692.3 −43.8% 100% 95.7%
Fixed 15.0 cm³ 0.1 cm³ 99.3% 61.7 mg 1230.8 — 100% 100%
📊 View Full Interactive Dashboard with All 11 Charts →